
Ask a rental desk what it needs from its system and the answer is rarely “a nicer product page”. It is: what goes out today, what is due back, what is late, and can I say yes to this enquiry for the 14th. Version 1.2.197 of the Sales Igniter rental module rebuilds that side of the software — four screens in the Magento 2 admin that answer those four questions, and answer them in milliseconds rather than seconds.
The headline number: a one-month inventory report across twenty products used to run roughly 7,000 database queries and take over a second. It now runs seven queries. Not seven thousand — seven. The serial-number report went from 13,930 queries and 2.6 seconds to six queries and 5.6 milliseconds. Those are measured figures, and the section at the end says exactly how they were measured.
Equipment rental inventory management software, inside your store admin
Most equipment rental inventory management software is a separate hosted product that you then have to keep in step with your website’s orders, stock and customers. The premise here is the opposite one: the rentals are already orders in your Magento store, the units are already products, so the operational screens belong in the same admin, reading the same tables, with no sync to go wrong and no second subscription. That is the same argument we make for self-hosted, open-source rental software with no monthly fee — this release is what it looks like in practice.
Rentals › Dashboard: the morning screen
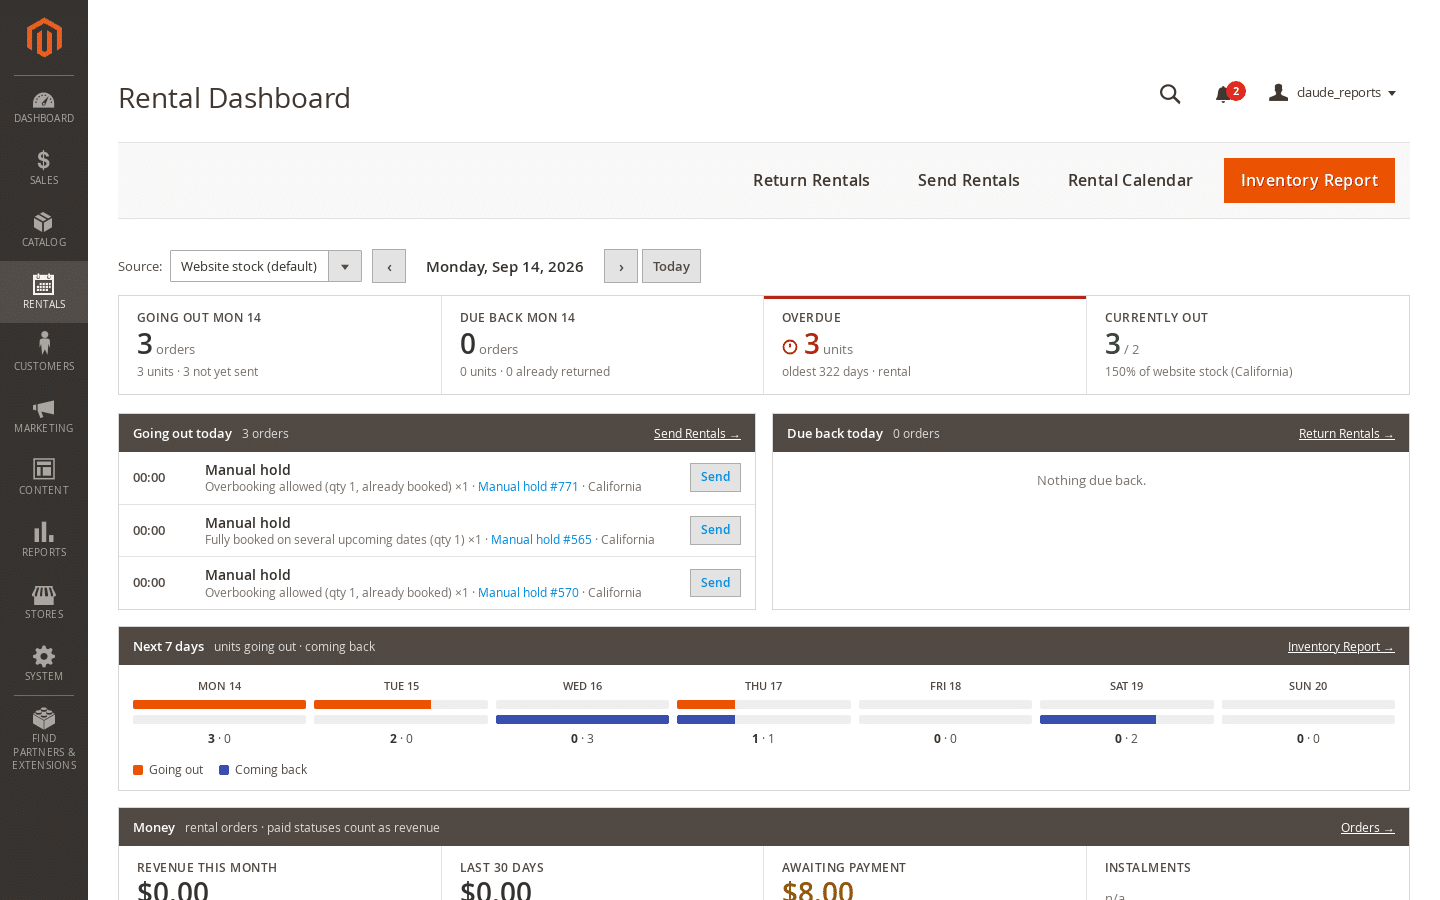
Four counters for the day you are looking at — going out, due back, overdue, currently out — then the actual lists behind them, with Sent and Returned pills and a link straight into the order or into the send and return queues. Underneath: the next seven days as units out against units back, an overdue list ordered oldest first with the days late and the customer, and what is currently out per product with the next return date against the stock in scope.
A money panel sits at the bottom: revenue this month, the last 30 days against the previous 30, the average rental order, what is awaiting payment, a twelve-week paid-versus-ordered chart and the top five products by revenue. Two decisions in there are worth stating plainly, because they change the numbers:
- Revenue means invoiced money, not a list of order statuses. An offline invoice — a cheque or a bank transfer — leaves the order sitting at pending while the money is real. Filtering on processing and complete hid exactly those orders, so it does not.
- Awaiting payment lists orders from the last 90 days that still owe something, oldest first, with the rental start date — so the desk can see what is about to ship unpaid.
Every panel arrives in a single JSON request, so stepping a day forward or changing the source is one round trip, not a page load.
Inventory Availability: a heat map of what you can still sell
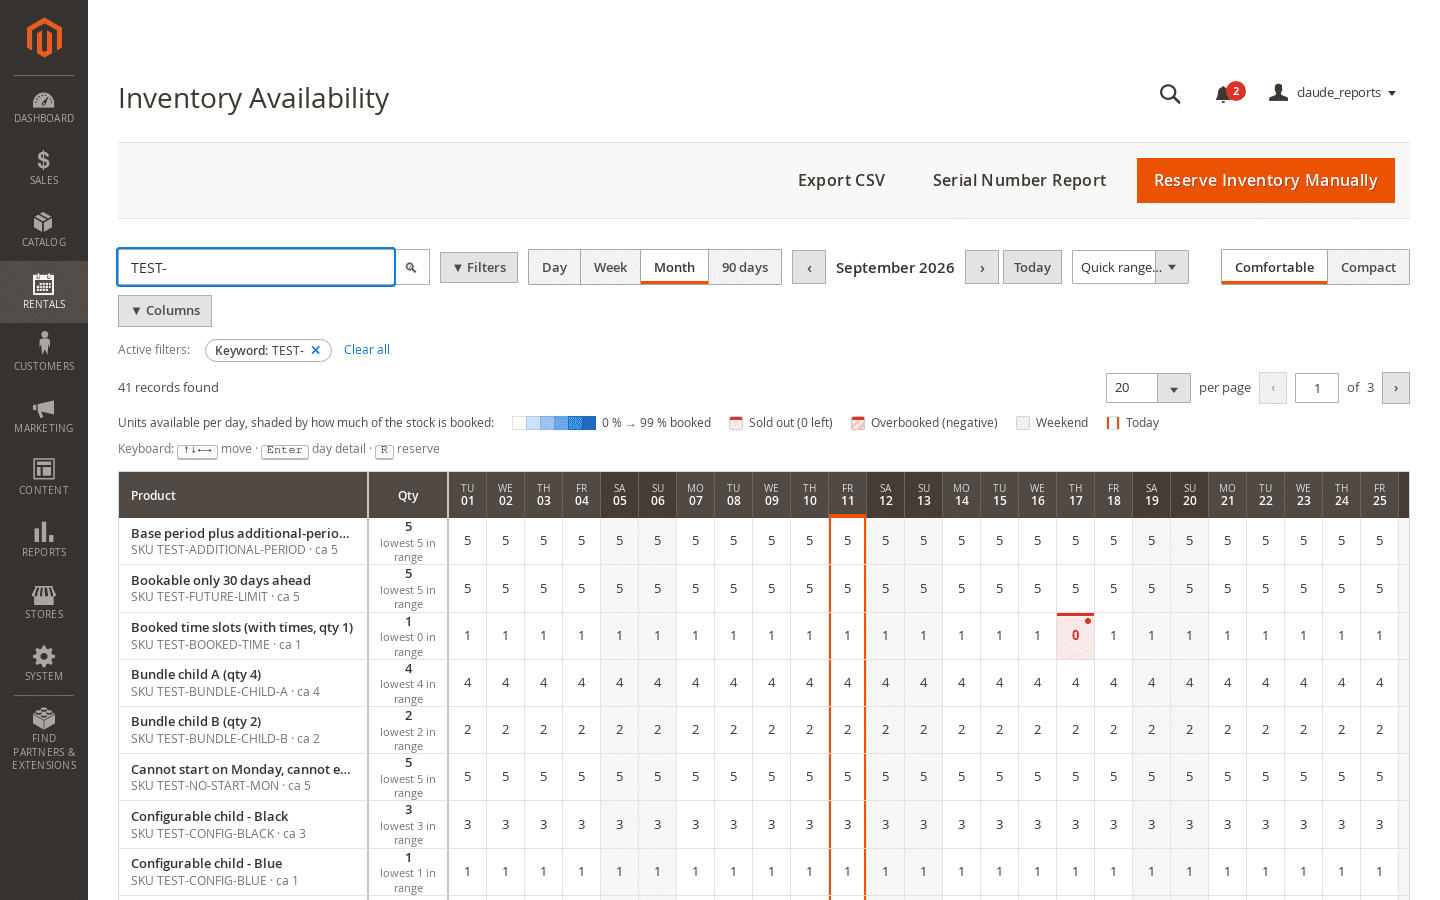
One row per product, one column per day, and the number in the cell is always the quantity still available. The shading behind it is the booked share of the stock, on a five-step ramp. Sold out and overbooked are deliberately not steps on that ramp — they are their own states, marked with a stripe, a dot and a hatch as well as colour, so they read for a colour-blind user and they read on a printout.
Around the grid is a standard Magento data-grid toolbar: keyword search, a Filters popover with removable chips, a Columns popover, per-page and pager, and Export CSV in the actions bar. Day, week, month and 90-day views with quick ranges and a Today button. The product and quantity columns stay pinned as you scroll sideways, and the day header stays pinned as you scroll down.
Filters that match how a rental desk actually thinks
- “Only products with a sold-out or overbooked day in range” — the one filter that turns a 43-product grid into the three rows you need to act on.
- Scope by source or by stock. The default is the website’s own stock, which is what your storefront can genuinely sell; you can also pick every source, a single warehouse or a named stock. Anyone running multi-source inventory across warehouses will want this one.
- A hover card on any cell breaks the reserved quantity down by order, manual hold, maintenance and quote request, and by source, then lists the reservations with links to the day detail, to reserve manually, or into the order.
- Full keyboard navigation — arrows to move, Home and End, Enter for the detail, R to reserve, Escape to close. A density toggle halves the row height when you want more of the month on screen.
Rental Calendar: Out / In by default
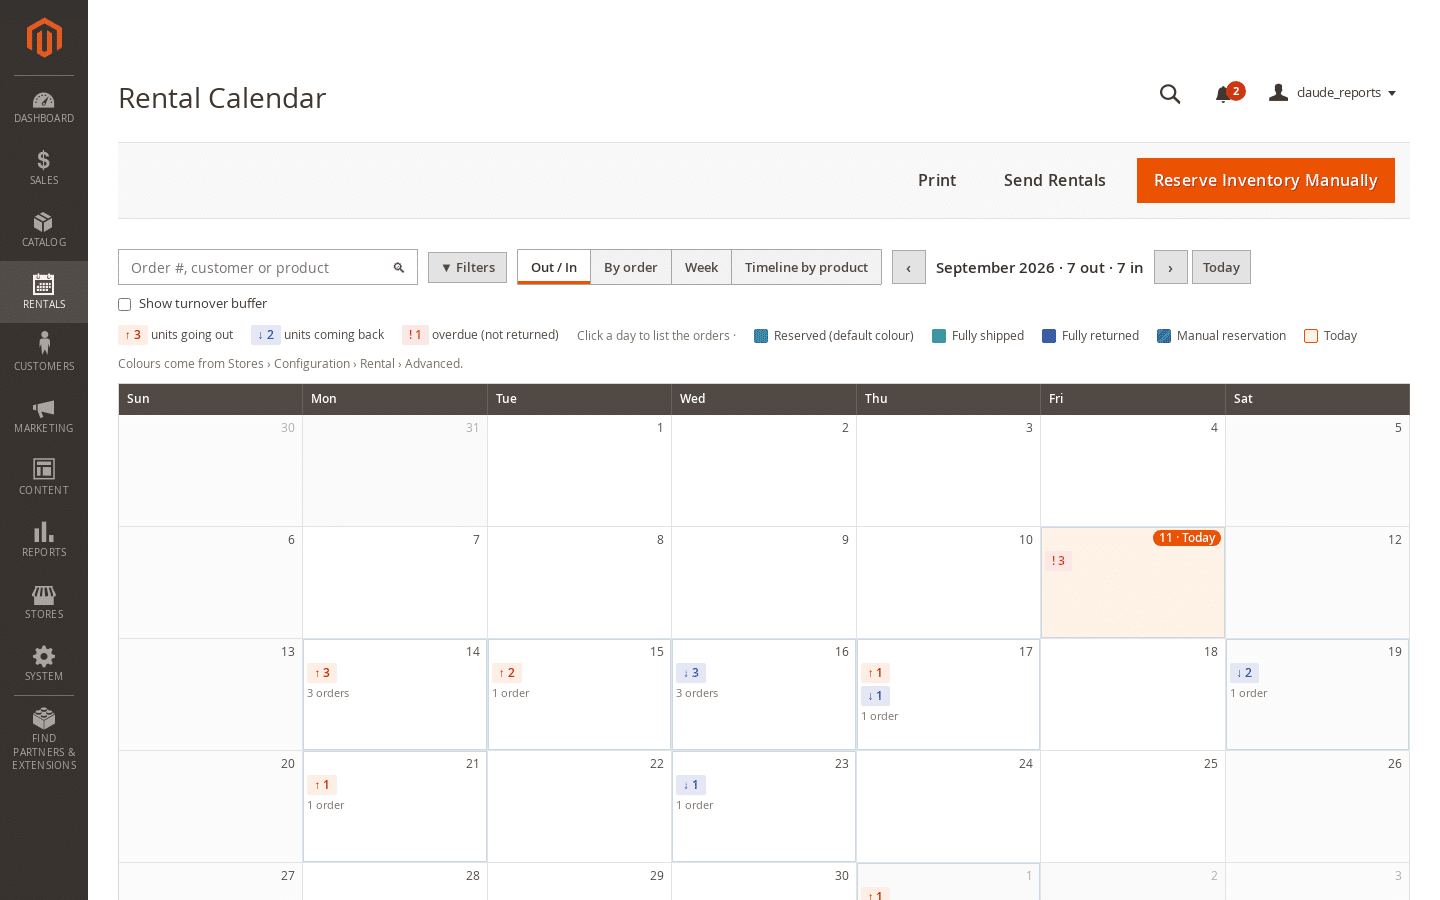
The calendar’s default view is now the one a depot actually uses: how many units go out on each day, how many come back, how many orders are behind those numbers, and overdue units in red on their due day and piled up on today. Click a day and a popover lists every pick-up and return on it with the order links and the Send and Return actions.
The other views are still there: By order as lane-packed bars across the month, Week as seven wide columns with the pick-up and return times, and Timeline by product with one row per product and a red underline on any day where reserved exceeds stock. Manual reservations are hatched and labelled as holds instead of being attributed to a phantom order, which is what the old feed did. A turnover-buffer toggle shows or hides your cleaning and transport gaps.
The whole calendar is plain HTML. The FullCalendar library it used to depend on, its stylesheet and the jQuery and Moment shims that came with it are deleted, and nothing replaced them — no CDN, no vendored calendar library. The fetched window is cached in the browser and the next month is prefetched, so stepping back to the month you just looked at costs zero requests.
Serial Numbers: one row per physical unit
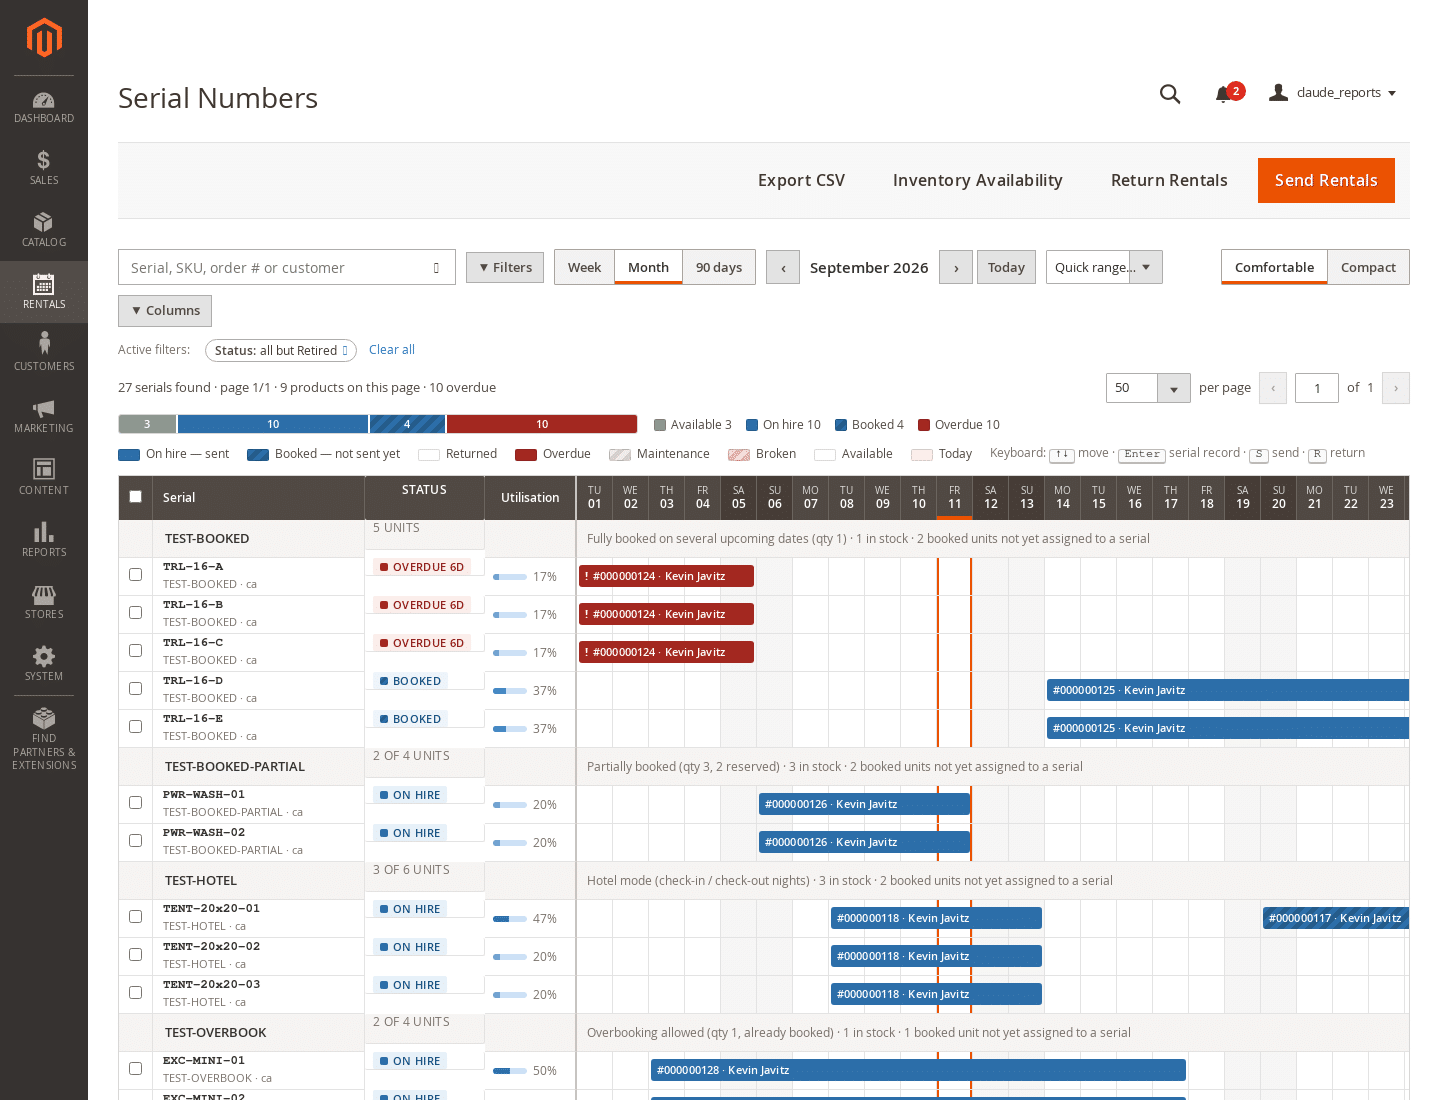
If you track individual assets rather than a quantity, this is the screen that tells you where each one is. One row per serial, grouped under its product, and each bar is a booking carrying the order number and the customer name — so a row reads as a sentence without clicking anything. Utilisation sits beside the status as a percentage.
Seven states, carried by two colours plus texture, a glyph and a written label so nothing depends on colour alone: blue means a booking exists, red means something is wrong, maintenance is a neutral hatch, broken is a red hatch, returned is outline only, and a retired unit is dimmed with its serial struck through. Retired is a new state rather than a delete, deliberately — deleting the row throws away the cost, the acquisition date and the booking history of an asset the business paid for.
- Search reaches orders and customers, not just serials and SKUs — the question is usually “where is the one Kevin had”, not “where is TRL-16-C”.
- A drawer on every serial with its source, stored status, cost, acquisition date, maintenance ticket, days out, utilisation, booking history and notes, plus links out to the order, the send or return grid, the maintenance ticket and the serial record.
- Bulk actions on a selection — send, return, raise a maintenance ticket, change status, or export just the selection. Send and Return deep-link into the matching grid already filtered to the reservations behind the units you picked.
- Cost and acquisition date are optional columns, off by default and always in the drawer and the CSV. Turning them on makes the screen a depreciation report on the days you want one.
Three real bugs were found and fixed while rebuilding it. The report used to render blank on arrival, because its first request fired before the block that owned the source and stock selects existed, so it filtered on an empty source; on our fixture fleet the first render showed 1,290 available cells and zero booked, and any interaction with the pager then corrected it to 993 and 305. The source and stock parameters were swapped, so a source filter silently became a stock filter. And the stored status and maintenance ticket were ignored entirely, so a unit in the workshop looked exactly like a unit out with a customer.
Why it is fast now, and how that was measured
The old inventory report cost around fifteen database queries per cell: product attribute reads, four inventory lookups, two reservation queries and a serialised inventory read, repeated for every product on every day. A month of twenty products is 620 cells, and the arithmetic does the rest. The serial report was worse, because it recomputed the whole product’s availability once per serial per day — of its 13,930 queries, nineteen actually read the serial table.
Both now fetch the window once and do the work in PHP. Here is the before and after, measured with Magento’s own query profiler around the same calls the controllers make, on PHP 8.3 and MariaDB 10.6 in developer mode:
| Request | Queries before | Time before | Queries after | Time after |
|---|---|---|---|---|
| Inventory, month (31 days, 620 cells) | 7,000 | 1,138 ms | 7 | 3.8 ms |
| Inventory, week (140 cells) | 1,580 | 255 ms | 7 | 3.2 ms |
| Inventory, 90-day view (1,800 cells) | not offered | — | 7 | 4.3 ms |
| Serials, month, 43 serials, every source | 13,930 | 2,636 ms | 6 | 5.6 ms |
| Serials, week, 20 serials | 1,780 | 649 ms | 6 | 5.3 ms |
| Calendar feed, one month by order | 8 | 20 ms | 3 | 1.0 ms |
The point is not the individual numbers, it is the shape. None of the queries scale with serials, days or cells any more. The tests assert it: thirty serials cost exactly what one serial costs, and ninety days cost exactly what thirty days cost. A ten-product depot and a two-thousand-unit fleet hit the database the same number of times.
Payloads fell with the query counts — a month of 43 serials went from 294 KB to 22 KB, because the report now sends one object per booking rather than one object per serial per day. In the browser, over HTTP and including Magento’s admin bootstrap, the dashboard answers in about 167 ms, the inventory report in about 121 ms and the rental calendar in about 131 ms. No caching layer was added, so those are cold numbers every time.
A fair caveat: these were measured on a development store with 43 rental products, around 30 live reservations and 128 orders. Your absolute milliseconds will differ. The query counts will not, which is the part that decides whether a report still works at ten times the size.
Less code, not more
Rebuilding these screens removed 3,958 lines of the old report stack — the Knockout renderers, their templates and the shared report blocks — along with the FullCalendar dependency. It also removed a module-wide preference that had been replacing every pager in the Magento admin, ours and Magento’s alike, purely to serve one rental screen. If you have ever wondered why an unrelated grid in your admin paged oddly, that may have been us, and it is gone.
Upgrading
Update the module and run setup:upgrade. The new screens sit under the Rentals menu with their own access-control resources, so existing admin roles keep working and you grant the dashboard and the serial report to whoever should see them. The Utilization report is untouched. Your reservations, serials and orders are read, never rewritten.
The same release overhauls what the customer sees, too — the four storefront calendars and native Hyvä theme support in the Magento 2 rental extension. You can try these screens on the free live rental software demo, see the full list and the price on the Magento 2 and Adobe Commerce rental booking module page, or compare it against the hosted alternatives on the Magento 2 rental booking comparison chart. There are more screens in the Magento 2 rental software screenshots.
Running on WordPress instead? The equivalent screens shipped for our WooCommerce rental and booking plugin, described in rental inventory tracking built into the WooCommerce admin. If you have not picked a platform yet, the Magento versus WooCommerce booking comparison is the place to start. And if there is a report you need that is not here, add it to the rental software feature requests and roadmap.