
The Usage report can add up what your serial custom fields recorded: how many miles each van covered, how many hours each machine ran, per rental and in total. Use it to see which units work hardest, to plan servicing, and to spot a unit that comes back with far more miles than its hires explain.
Go to Rentals > Reports > Usage Report and set Group by to Serial custom fields. A Field list appears next to it, with the fields grouped by field set: choose the one to report on.
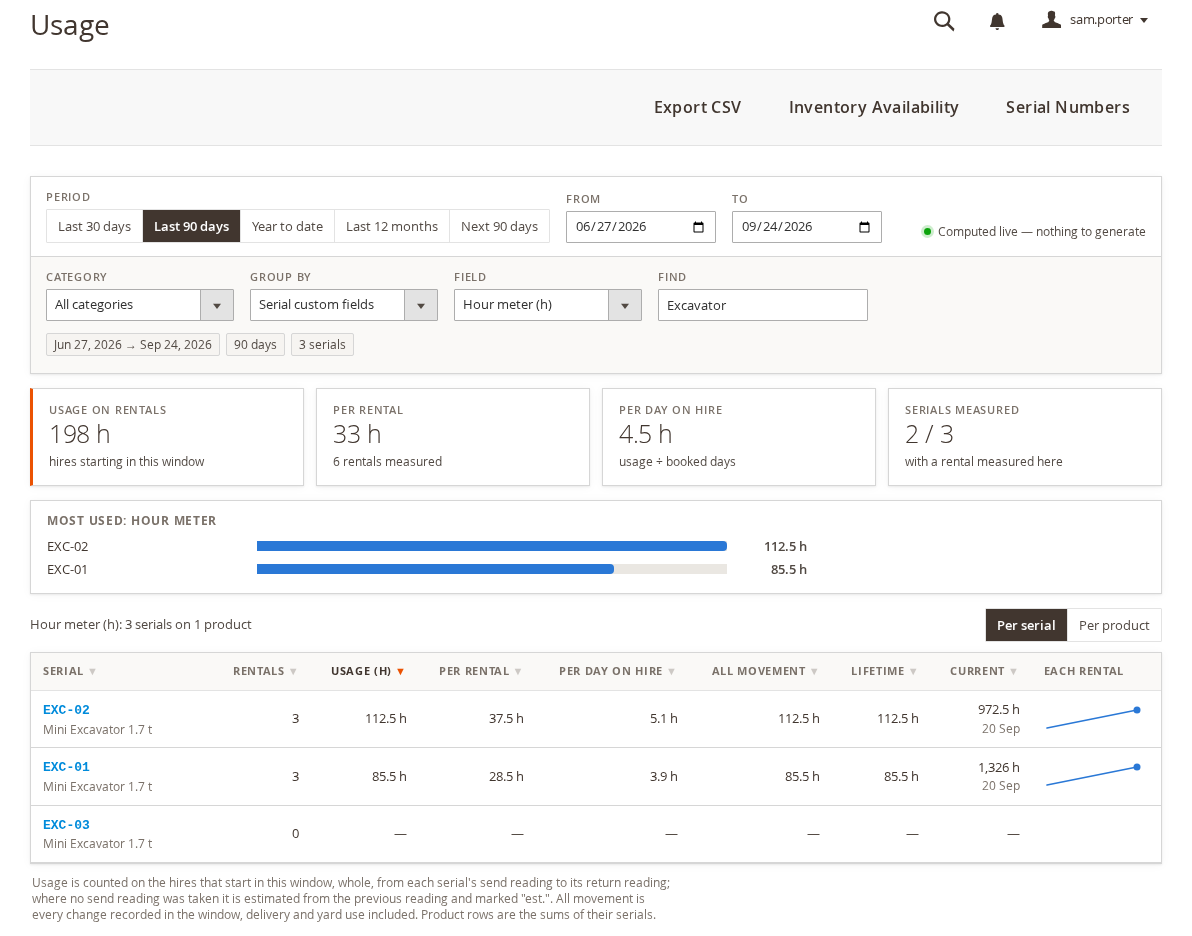
The period buttons, the dates, the category and the Find box (a serial code, a product name or a SKU) work as they do in the rest of the report.
Meters #
For a meter (an odometer, an hour meter, a shutter count) the tiles at the top show:
- Usage on rentals: the total over the rentals in the period;
- Per rental: the average for one rental;
- Per day on hire: usage divided by the booked days;
- Serials measured: how many units had a rental measured in the period, out of how many carry the field.
Most used ranks the units, and the table has one row per unit (or per product, with Per product):
| Column | What it shows |
|---|---|
| Rentals | Rentals measured in the period. |
| Usage | The total over those rentals. |
| Per rental / Per day on hire | The averages. |
| All movement | Every change the meter recorded in the period, including deliveries, yard moves and anything between rentals. |
| Lifetime | Everything the meter has counted since its first reading. |
| Current | The latest reading and its date. |
| Each rental | A small chart of the usage of each rental, in order. |
How the usage of a rental is counted:
- A rental belongs to the period it starts in, and is counted whole. A meter is read when the unit goes out and when it comes back, so one hire’s miles cannot be split at the edge of the period.
- It is the return reading minus the send reading. If no reading was taken at send, the reading before is used instead and the figure is marked est.
- A unit that is still out counts up to its latest reading.
- Corrections and voids are taken into account; a meter that rolled over or was replaced is counted correctly.
Numbers, choices and yes / no fields #
- For a number field (fuel %, tread depth) the report shows the readings taken in the period: how many, the average, the lowest, the highest and the latest.
- For a choice or yes / no field (fuel level, cleaned) it shows how often each answer was recorded.
One unit on its own #
Every serial’s page has a Usage report button, and every saved row of the product’s Serial Numbers grid has a Usage icon. Both open the report on that one unit, with a line saying so. show all goes back to every unit.
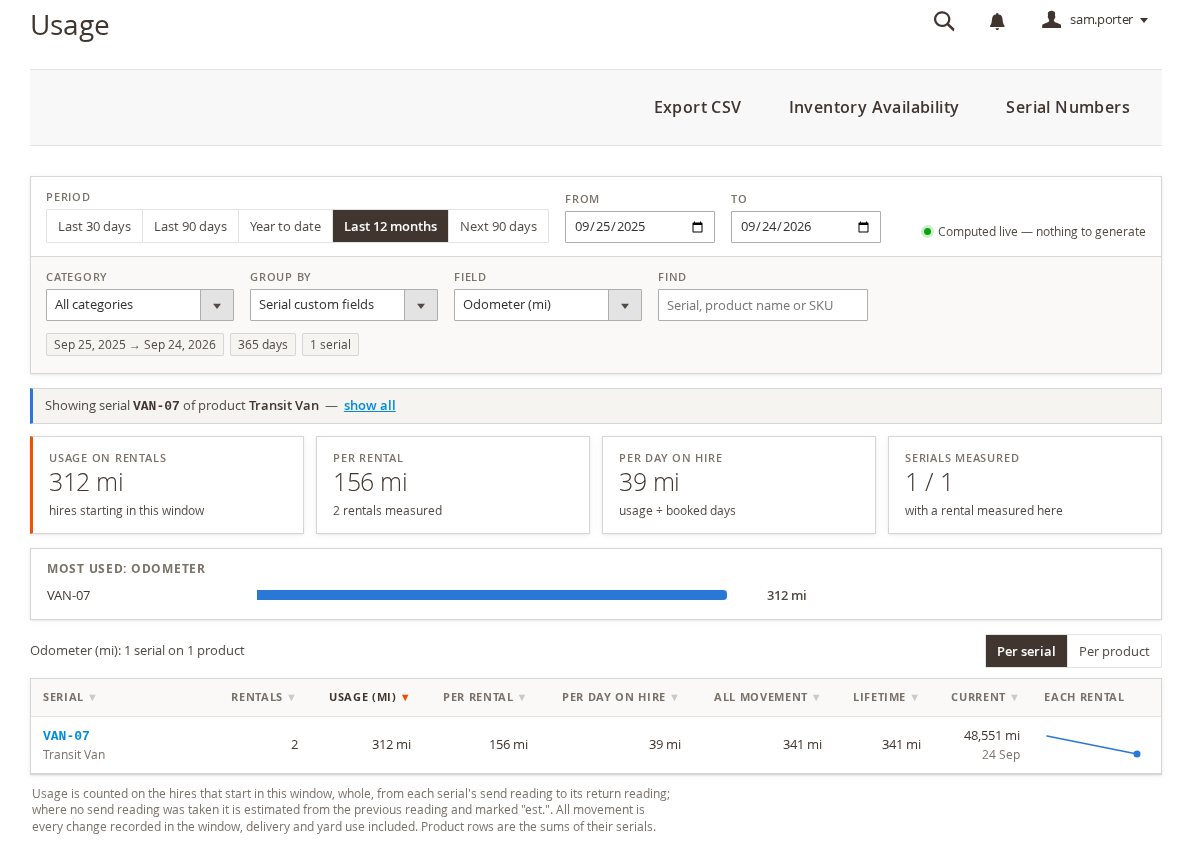
The same filter applies when Group by is Serial number, so you can switch between the unit’s utilization and its readings without losing it. See Utilization Report for the utilization side of the report.
Export #
Export CSV downloads every unit for the chosen field, period and filters, not only the page on screen.


