
The Inventory Report shows, for every rental product, how many units are still free on each day. It answers “can I take this booking?” at a glance and shows sold-out days before your customers find them. You’ll find it under Rentals > Inventory Report.
The report is part of every edition of Rentals & Bookings. Lite shows one week at a time; Regular and Pro can switch between 7, 14 and 30 days.
Reading the grid #
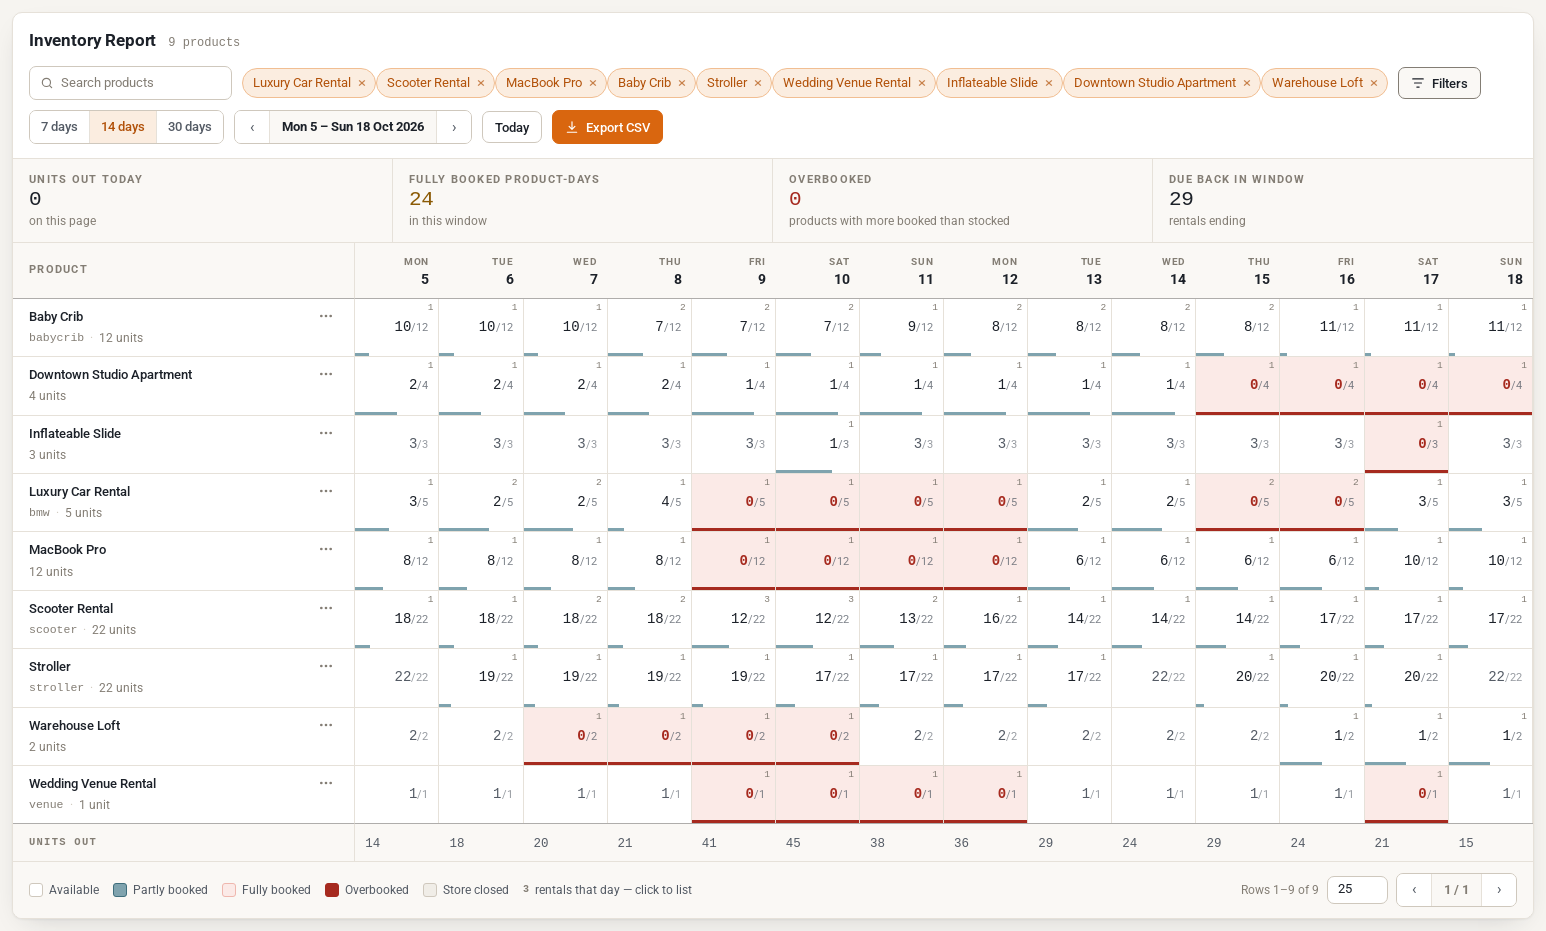
Products run down the side and days run across the top. Each cell shows units still available / units in stock for that day, so 7/12 means 7 of your 12 units are free.
- Under each product name you’ll see its SKU and how many units you have. The unit count is the product’s WooCommerce stock quantity. A product that doesn’t manage stock says unlimited, and its cells show how many units are out instead.
- Variable products get one row per variation that manages its own stock, so a dress in blue and red appears as Dress – Blue and Dress – Red.
- The small number in the corner of a cell is how many rentals touch that day. Click the cell to see them (see below).
- The bar along the bottom of a cell shows how much of the stock is out that day.
- Units out, the last row, adds up the units on hire each day across the products on the page.
- Today is marked with an orange line when it falls inside the window.
The colours, which the legend under the grid repeats:
| Cell | What it means |
|---|---|
| White | Available: nothing is booked that day. |
| Slate bar | Partly booked: some units are out and some are free. |
| Pink with a red line | Fully booked: no units left. Customers can’t pick this day on the product page. |
| Dark red | Overbooked: more units are booked than you have in stock, for example after lowering a product’s stock quantity. Check these first. |
| Grey | Store closed: a store-wide closed day or holiday from Rentals > Settings > Calendar that applies to both pick-up and return. Closed days set on a single product are not shaded. |
A unit counts as booked for the whole rental, including any turnover time (the Buffer Before Booking and Buffer After Booking settings), because it can’t be rented to anyone else then. Orders that are cancelled, refunded or failed release their units. Bookings you add by hand under Rentals > Bookings count too, and so do dates blocked by an iCal calendar you import (Regular and Pro).
The summary strip #
The four figures above the grid cover the products and days you’re looking at:
- Units out today: units on hire today out of the total stock of the products on this page. It shows 0 when today isn’t in the window.
- Fully booked product-days: how many cells have nothing left.
- Overbooked: how many products have at least one day with more booked than stocked.
- Due back in window: how many rentals end inside the window.
Choosing the days #
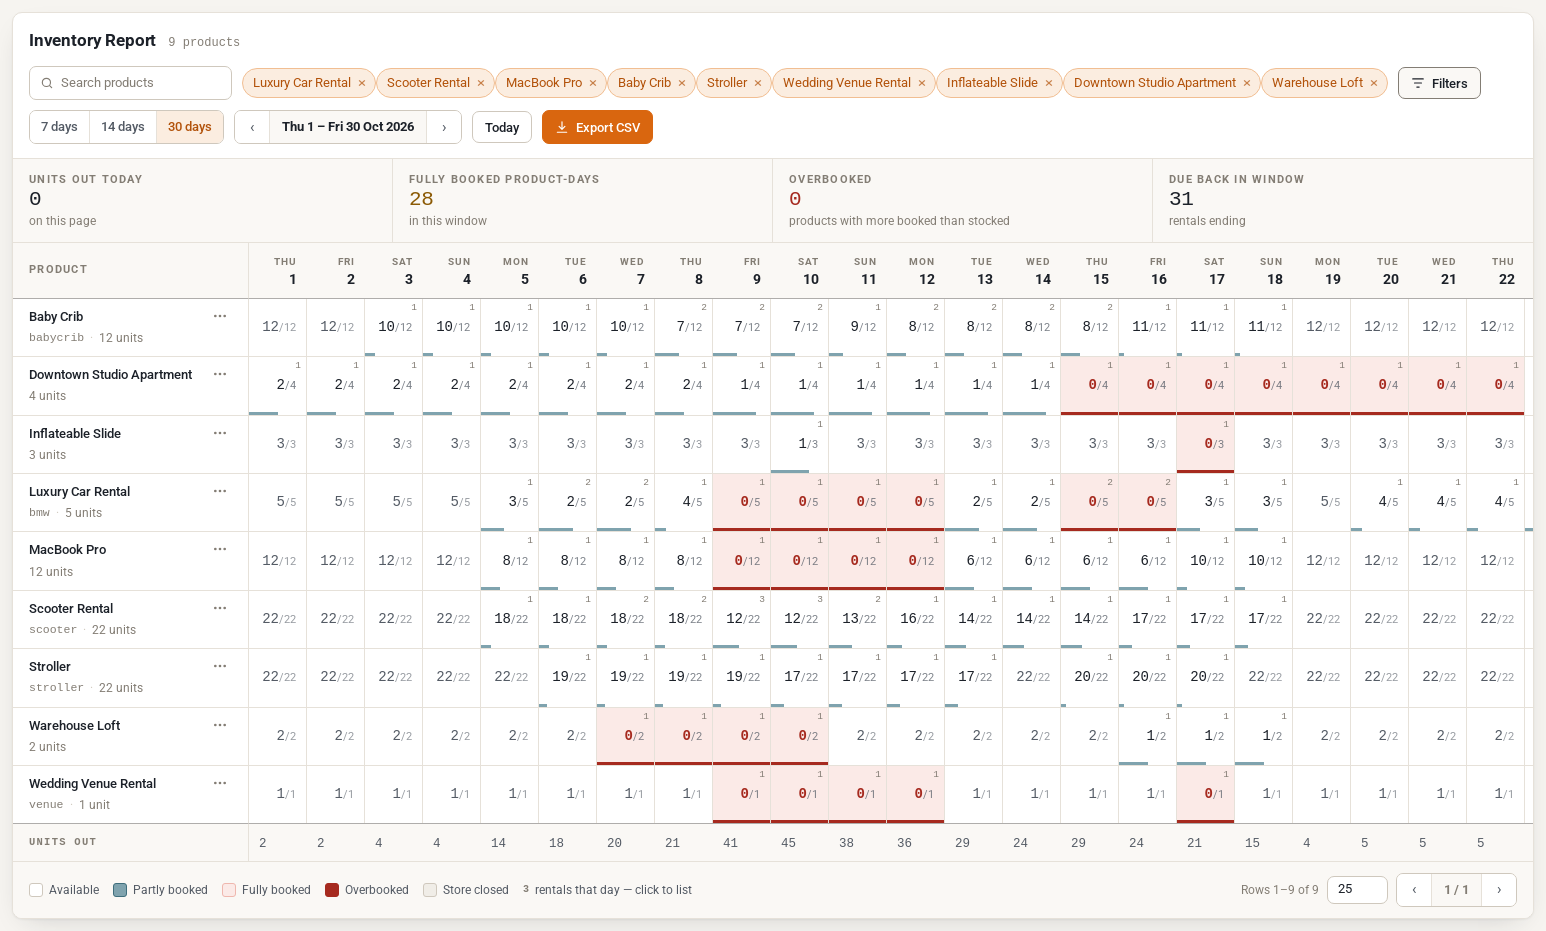
- 7 days / 14 days / 30 days sets the window length (Regular and Pro; Lite shows 7 days). Your browser remembers the choice.
- ‹ and › move a whole window back or forward. The label between them shows the dates on screen.
- Today jumps back to a window starting today.
With 30 days the grid is wider than the screen, so scroll sideways to see the rest of the month.
Search #
Type in Search products to narrow the list by product name; the grid updates as you type. The pager under the grid shows 10, 25, 50 or 100 products per page, and your browser remembers that too.
See who has it: click a day #
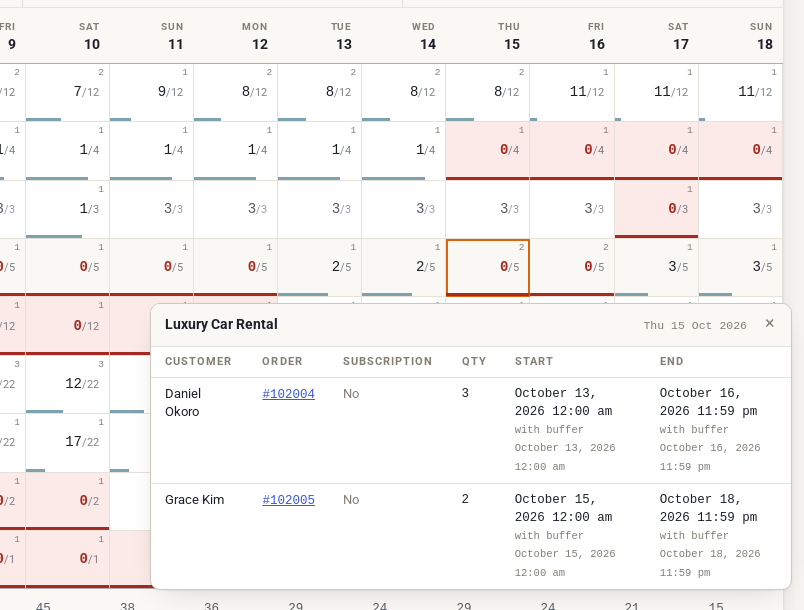
Click a day that has rentals (or tab to it and press Enter) to list them. For each one you’ll see the customer, a link to the order, whether it’s a subscription (and whether it’s a renewal), the quantity, and the start and end, both as booked and with turnover time added. A booking you added without an order shows as Manual booking.
The product menu #
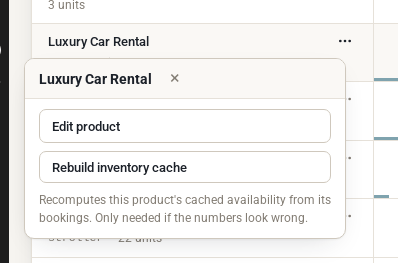
The ⋯ button next to each product name opens two actions:
- Edit product opens the product’s edit screen (clicking the product name does the same).
- Rebuild inventory cache recomputes the product’s stored availability from its bookings. Availability is worked out from the bookings every time the report loads, so you only need this if the numbers look wrong.
Export to CSV #
Export CSV downloads the window you’re looking at, with the same search, for every matching product rather than only the current page. The file has a Product and a Units column and one column per date. Each cell reads available/total (for example 7/12), or N out for a product without managed stock, and the last row holds the Units out totals. It opens in Excel, Numbers or Google Sheets.
Related #
- Adding rental products: stock quantity, rental type and turnover buffers per product.
- Rentals & Bookings settings: store closed days, holidays and default buffers.
- Send and Return: record when units go out and come back (Regular and Pro).


