
The reports answer the questions that decide what you buy, repair or retire: which items cost the most to keep, how long units are off the calendar, whether repairs cost you rentals, and whether services are done on time.
Maintenance › Reports #
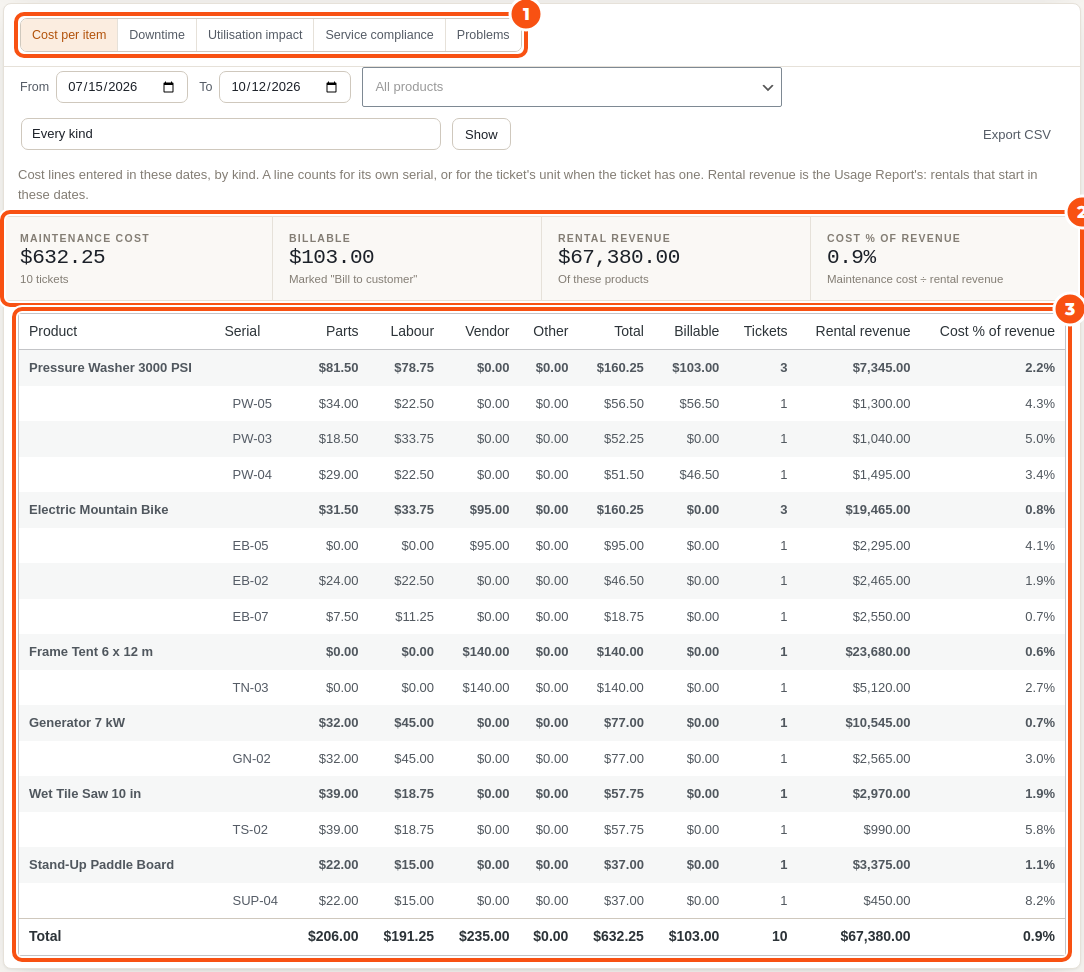
Go to Maintenance › Reports. Every report has From and To dates, a Product filter, a Location filter (when you rent from more than one location), a Ticket kind filter, a short line that says how it counts, a summary row and Export CSV.
| Report | What it shows |
|---|---|
| Cost per item | Cost lines entered in the dates, by kind (parts, labour, vendor, other), per product and unit, against the rental revenue of those products (the Usage Report’s: rentals that start in the dates). Also the billable total. |
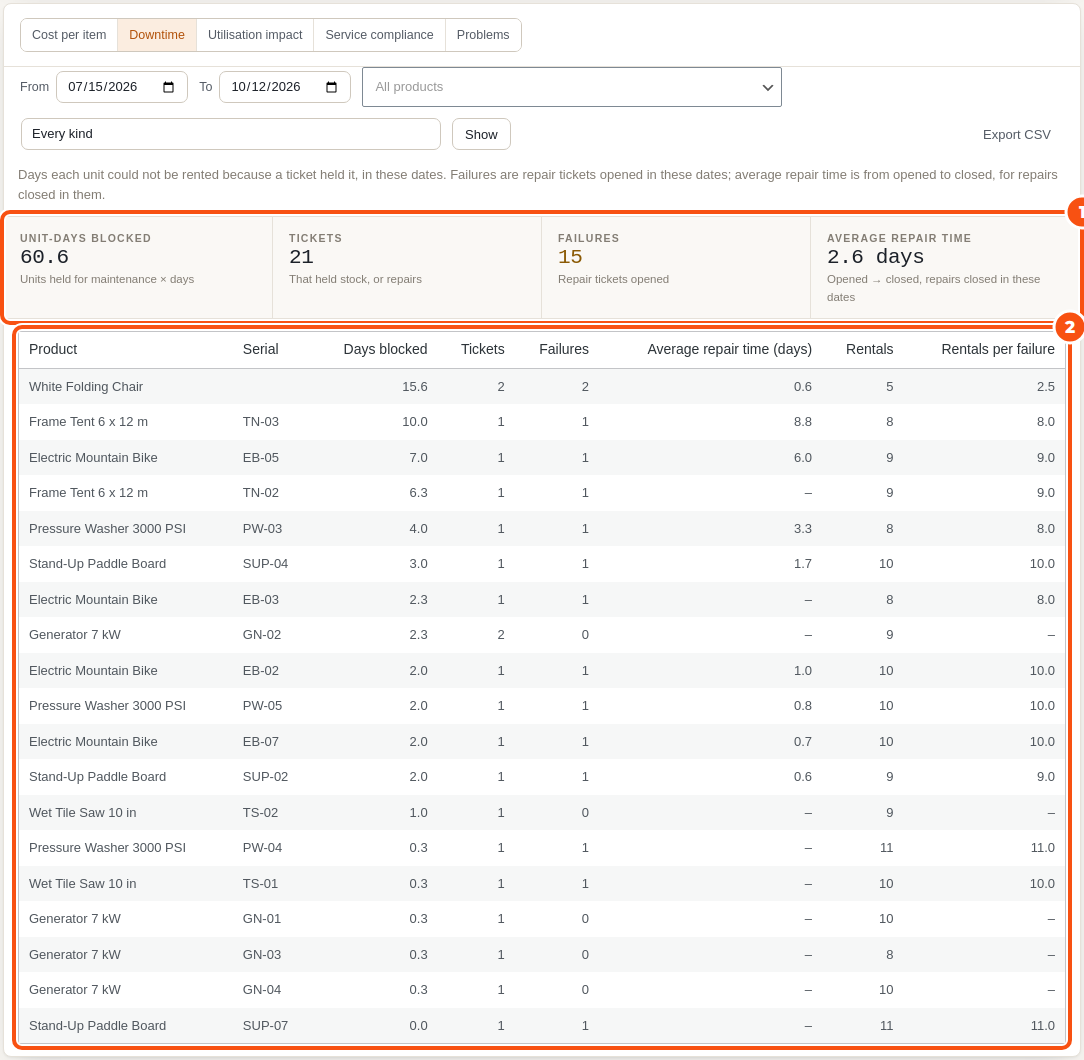
| Downtime | The days each unit could not be rented because a ticket held it, the failures (repair tickets opened), the average repair time (opened to closed) and rentals per failure. |
| Utilisation impact | Unit-days held for maintenance against the unit-days of stock, the rented share, and the shortage days: days with units held on which rentals and held units used all the stock. |
| Service compliance | Services from a schedule done in the dates: on time, late, and units overdue now. A service opened by rentals or meter readings is on time when it was done before it became overdue. |
| Problems | Tickets opened in the dates by problem, across every product and by product. |
On the board and the dashboard #
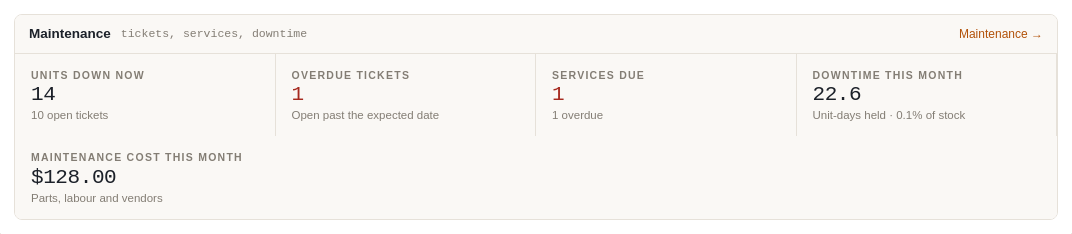
The board shows Downtime this month and Cost this month next to its other cards. The Regular edition’s Rentals dashboard gets a Maintenance card: units down now, overdue tickets, services due, downtime and cost this month, with a link to the board.
The data behind them #
Costs come from the tickets’ Costs cards, downtime from the time each ticket held its units, revenue from the Regular edition’s Usage Report. The REST API serves every report as JSON (/maintenance/reports/{type}): see Settings, emails and developer notes.


